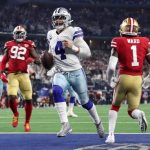
Cowboys Is Brock Purdy as good as his numbers say he is? Which is the real Dak Prescott; the one from Monday night or the NFL’s interception leader? Almost every conversation about this weekend’s titanic clash revolves around these digestible narratives. Those in the know, know it’s much more nuanced than the simple answer. There are eye-test anecdotes people tend to rely on; but when was their last eye exam, anyway?
No, the numbers tell a much more complete story. Analytics spit in the already-mentioned eye of the common refrain of lies, damn lies and statistics. They can’t explain what’s going to happen every time, but they certainly frame the picture of what is most likely to occur. So for this Cowboys-49ers rematch and latest chapter in an epic rivalry, it only makes sense to dive into the analytics to answer the opening two questions.
For that, we brought in the big gun. Daniel Houston, better known on Twitter by the handle CowboysStats (a must follow), lent us his insight on the fascinating QBs, their offenses and the how they intersect with each other in a detailed Q&A session.
Here’s the honest truth preview of Cowboys -49ers
Cowboys Wire: Let’s start with the elephant in the room. Has Kyle Shanahan built the world’s most QB-friendly offense? Do the metrics have insight on how much of their success is independent of Brock Purdy and are there numerical clues as to what works against their attack?
Cowboys Stats: I think he has. Just about every quarterback who’s played in the Shanahan offense — whether a Jimmy G backup, high draft pick or Brock Purdy — has benefited from elite production on yards after the catch, even after accounting for down, distance and target location. This is an area where play design seems to be having a big impact on how this offense moves the chains.
That said, Purdy has so far excelled at completing passes on third down and executing the offense in a way that other Garoppolo backups have not. His completion rates on 3rd down appear to be driving his EPA accuracy component in this case, even as his CPOE is fairly middling. If that continues on Sunday, the Cowboys defense could be in for a tough day.
There are some opportunities for Dallas, though.
Purdy has been fairly sackable, doesn’t pose much of a threat as a scrambler and is most comfortable working the short and intermediate parts of the field. He’s also unlikely to maintain an interception rate this low (2.4%) going forward, given that he does take the occasional risk downfield. A defense that can apply consistent pressure and play soundly in coverage near the sticks has a shot to frustrate him, I think.
So let’s shift the focus to the Dallas scheme and QB combo. You’ve been as vocal as I have about what the real narrative should be this season. Can you bring us up to speed about what Prescott has been?
Cowboys Stats:
Yeah, what bothers me the most about the narrative this year is how Prescott’s entire season has been viewed through the lens of his interception tally alone. The more we hyper-focus on the 15 passes that got picked off, the more we overlook what Prescott has been doing on the other 97% of his plays. And the stuff that hasn’t gotten as much attention has been pretty special.
Despite playing behind a shaky offensive line, Prescott continues to navigate pressure and avoid sacks at the league’s fifth-best rate. Despite largely unreliable options downfield, Prescott has been able to consistently find his receivers in high-value locations.
On third downs, when the defense generally knows he’s going to pass and the entire drive is on the line, Prescott targeted receivers nearly 4 yards beyond the sticks on average. That’s the second-farthest downfield of any quarterback this year. Partly as a result of this knack for exploiting defenses, he has the league’s fourth-best success rate in these drive-saving situations.
At the same time, these risks don’t always pay off.
Seven of Prescott’s interceptions this year have come on must-pass third downs. Two more have come on 2nd-and-18+, and another two picks happened in 2 minute drill situations before halftime. That leaves four interceptions on somewhat “normal” first and second downs.
So with some positive results and some negative ones, how do we make sense of Prescott’s risk profile this year? How do we know what he’s doing is effective on balance?
My preferred tool for this is an expected-points model, which considers the down, distance, field position and other information to estimate the impact of each play on a team’s scoring expectancy. And while Prescott’s interceptions have been costly, that impact is dwarfed by that of the other 97% of his plays. Across all situations, Prescott ranks No. 5 overall in expected points added per play, even though the formula heavily penalizes QBs for turning the ball over. By moving the chains and preventing numerous punts, Prescott is providing more than enough value to offset the interceptions.
